
2025 Soil Health Study Summary
Bill Brinkley and Craig Givens
University of Kentucky, Lexington
Our focus in 2025 was on 40 cropland sites with similar soil types located in Logan, Todd, Simpson, Christian, and Caldwell Counties in Kentucky. One site was sampled in Elizabeth, Indiana. The majority of sites were on some of the most progressive farms in each county, using good management practices while producing high yielding crops. The predominant crop rotation was corn, followed by wheat or small grain, followed by double-cropped soybeans.
There are so many variables that can impact soil health with different cropping and tillage practices. Soil health testing is a moment-in-time that has been influenced by many years of practices. This makes it difficult to look at the current set of management practices and decide just how much these are contributing to the overall soil health score. The past history of sampling sites has such an impact on the current soil health score. This is important to note and to not compare field scores as much as to monitor fields over time to see if soil health scores are improving or declining.
Data gathered at each of the 40 sites included water infiltration rates, soil bulk density, cropping and tillage practices, and a complete lab analysis of soil health parameters.
The soil samples were submitted to Waters Agricultural Labs, Inc. in Owensboro, Kentucky to complete their soil health analysis package. Waters Agricultural Lab soil health scoring system considers the analysis of 5 soil health parameters which are weighted to arrive at the overall soil health score. These parameters include:
Solvita - CO2 Burst (ppm)
Solvita - SLAN (ppm)
Active Carbon (ppm)
Aggregate Stability (%)
Organic Matter (%).
The soil health scoring system is rated as follows:
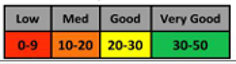
The 40 sites tested had the follow soil health score ranges.
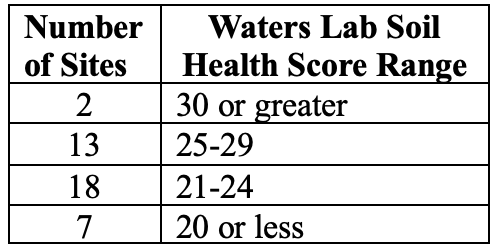
The highest soil health score was a 31. There were two soil samples receiving this score. One site was an organic garden with a diverse cover cropping history and limited tillage. The second site was a no-tilled crop field which was in a rotation of 2 years of red clover followed by 2-3 years of row crop and limited pesticide applications.
The lowest soil health score from the sampling group was a score of 17. This was on a site being strip tilled without a cover crop and possibly with a past history of tobacco being grown on the site. This site was intensively managed. There were several sites with a score of 18. Some of these sites were no-tilled and some had tillage. Most of the full-width tillage was implemented prior to wheat planting.
When the 40 samples were separated by scores into high, medium, and low scoring sites it was interesting to compare the field practices. There was somewhat of a pattern that appeared to develop. Again, these are very difficult to show consistently due to all the past history of each site and differences in management practices over the years.
Some observation notes. The sites with the most diverse cropping systems (with more variety of crops and cover crops) and less intensively managed, (including less aggressive tillage and fewer pesticide applications) tended to have a higher soil health score. However this was not always the case.
It seemed the greater the number of management practices which kills or reduces biological life took away from overall soil health score. This may seem somewhat elementary, but it is perhaps likely not a strong consideration when making many management or pest control decisions.
Realizing there are both good and bad soil disturbances that contribute to overall soil health. A bad soil disturbance might include full-width tillage, high salt fertilizer application, herbicide, insecticide, or fungicide applications, residue removal, continually growing low residue crops, or lower diversity cropping systems. These impact soil health scores negatively.
Sites with good soil disturbance practices, such as increased crop diversity, cover crops, including some perennial crops in the rotation, the addition of animal manures, and/or reduced pesticide applications tended to have higher soil health scores. Again, this seemed to be a pattern, but difficult to quantify with data.
When considering water infiltration and soil bulk density there is more complexity. Tillage, in the short term, increased water infiltration rates and reduced bulk density. Sites with heavy tillage would show outstanding water infiltration rates shortly after tillage. However, these infiltration rates declined with each heavy rainfall event as the soil crusted on the soil surface and soil pores filled with fine sediment particles. These heavy tillage sites also showed some of the lowest aggregate stability percentages. With the natural glues that bind soil particles together being destroyed, these soils had weaker aggregate stability and would erode more easily. Full-width tillage also created an environment where soils would compress more easily resulting in compaction following heavy traffic.
In-line soil ripping or strip tillage showed benefits over full-width tillage. This practice leaves much of the crop residues on the soil surface and did not show the levels of soil crusting as other more aggressive tillage practices. The added soil residue armor provided benefits against rainfall impact on the soil surface. However, the water infiltration rates were not as good on the deep tillage sites compared to the full-width tillage sites shortly after the tillage event. Aggregate stability was better on sites with the less aggressive tillage practices.
The long term no-till sites, especially with high intensity management, had some of the lowest water infiltration rates and highest bulk density readings. No-till sites which had recently been brought into crop production from perennial vegetation were much better at infiltrating water and had a lower bulk density as compared to other sites. The cover crop systems being used on these sampling sites tended to be grass monocultures and were not allowed enough time to grow very large before termination. We did not notice any great improvements in water infiltration rates or reduced bulk density results where these small grain monoculture cover crops were being used. However, there was good evidence of less soil erosion due to better soil armoring on these sites from the small grain during winter months.
There is still not a clear conclusion exactly which practices are the primary contributor to the overall decline in soil health scores. These lower scores correlate with increasing soil bulk density readings and poorer water infiltration rates.
Questions still remain concerning how best to implement a more diverse cropping system, with increased positive soil health impacts, while maintaining high crop yields and overall crop productivity.
Our focus in 2026 will be to concentrate on isolating some of the lowest scoring soil health sites and further comparing these sites with others where the soil health rating is better. In addition, more thought will be given to finding successful cover crop practices or crop rotations that will more likely benefit soil biological health conditions on these continuously cropped fields.
The original research file can be downloaded here.
The KY Small Grains Promotion Council is proud to sponsor research that covers real-world issues important to Kentucky farmers.